Half-Hourly Data Explained: Why It Matters More Than Your Monthly Total
Picture two buildings. Both used exactly 10,000 kWh last month. Same total, right down to the decimal.
Building A used it in a smooth, predictable curve, rising in the morning, holding steady through the working day, tapering off at night. Building B used the exact same amount, except a piece of equipment got left running every night from midnight to 6am, quietly burning through a third of that total while the building sat empty.
The monthly bill for both buildings looks identical. The actual story couldn't be more different. That gap is exactly what half-hourly data exists to close.
What Half-Hourly Data Actually Is
Half-hourly data is consumption recorded in 30-minute intervals rather than as a single cumulative figure per billing cycle. It's the standard granularity for commercial electricity metering in markets like the UK and Ireland, generated automatically by smart meters.
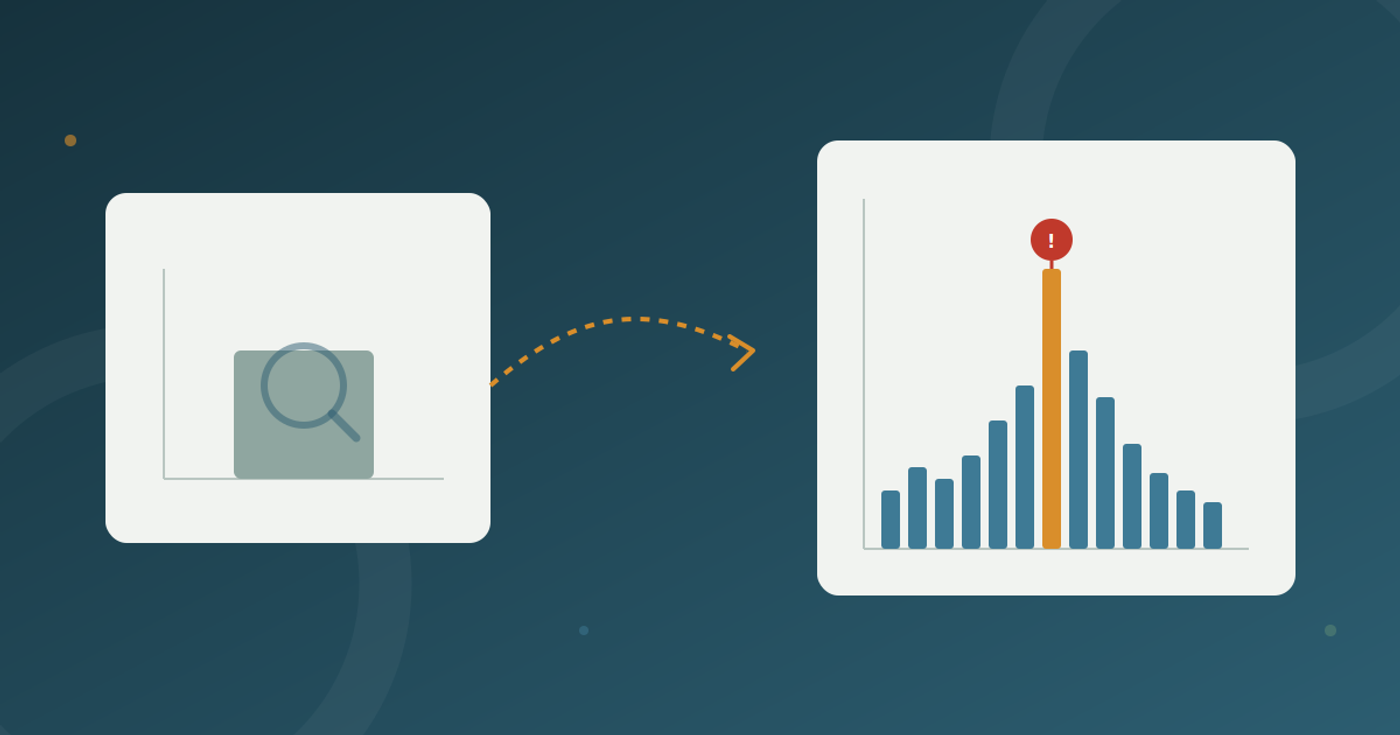
Instead of one number, "10,000 kWh this month," you get roughly 1,400 numbers: exactly how much was consumed in every half-hour window, all month long. That's the entire shift in one sentence. It's the move from a total to a timeline.
Why a Monthly Total Genuinely Hides Things
It's worth being specific about what a monthly total actually can't tell you, because the loss is bigger than people usually assume.
- It can't tell you when consumption happened. A spike at 3am and a spike at 3pm look identical once they're folded into a single sum.
- It can't distinguish "used a lot, briefly" from "used a little, constantly." Both can add up to the same total, and they mean completely different things operationally.
- It can't reveal a developing problem until it's already expensive. A fault that gradually worsens over three weeks doesn't announce itself in a monthly number. It just makes next month's bill somewhat higher, with no indication of why.
- It can't support anything time-sensitive. No time-of-use tariff, no meaningful demand management, no real anomaly detection. All of these require knowing when energy was used, not just how much.
None of this is a flaw in billing, exactly. A monthly total does what it's designed to do, which is tell a supplier how much to charge you. It was never designed to tell you anything about how your building actually behaves.
What Half-Hourly Data Actually Reveals
Once consumption is broken into 30-minute windows, a few genuinely useful things become visible for the first time.
Your load profile. This is the shape of your consumption across a day: when it rises, when it peaks, when it falls. A load profile turns "we use energy" into "here's specifically when and how," which is the first real diagnostic step for finding waste.
Base load versus peak load. Base load is what you use even when nothing much is happening: nights, weekends, quiet hours. It should be low and boring. When it's not, that's usually equipment left running that shouldn't be, and half-hourly data is what makes that visible instead of buried inside a monthly average.
Timing of peak demand. Many commercial tariffs include demand charges based on your highest usage moment in a billing period, meaning a single half-hour spike can meaningfully affect your bill regardless of your total consumption. Without interval data, you have no way to even know when that peak occurred, let alone manage it.
Early signs of a developing fault. A compressor slowly drawing more power each week, a thermostat drifting out of calibration. These show up as a gradual shift in the shape of specific half-hour windows, long before they show up as a shocking total.
Why This Enables Things That Simply Don't Work Otherwise
Two entire categories of energy management depend on half-hourly data existing at all.
Time-of-use tariffs only make sense if a supplier can actually see when you consumed electricity. Charging differently for peak versus off-peak periods is meaningless without interval-level visibility into which period your usage fell into.
Anomaly detection, meaning software flagging "this looks unusual," needs a baseline of what normal half-hour-by-half-hour consumption looks like in order to spot a deviation. A monthly total gives you nothing to compare against except last month's monthly total, which is a comparison too coarse to catch almost anything useful.
The Catch: Having the Data Isn't the Same as Using It
Here's the part worth being honest about, and it connects directly to something worth checking if you haven't already. Your smart meter is very likely already generating half-hourly data right now, whether or not anyone is actually looking at it.
Many suppliers receive this interval data and simply collapse it back down into the same flat monthly figure on your bill, without exposing the underlying detail to you at all. The data exists. It's just sitting unused in a supplier's backend, doing nothing more useful than it would if it had never been collected in the first place.
This is the actual gap that dedicated monitoring platforms close. Not generating new data, but making the data that already exists visible and usable.
What to Actually Do With This
- Check whether you're getting interval-level access at all, or just a slightly more frequent version of a flat total. These are very different outcomes from the same underlying smart meter.
- Look at your load profile before assuming you need new equipment. A surprising number of "we need a more efficient system" conversations are actually "we need to stop running the current system overnight" conversations, and only half-hourly data reveals that distinction.
- Pay attention to base load specifically. It's the single easiest place to spot avoidable waste, precisely because it should be low and stable. Any deviation stands out clearly once you're looking at 30-minute windows instead of a monthly average.
A monthly total will always tell you how much you spent. Half-hourly data is what tells you why, and why is the only part you can actually act on.