Make sense of every utility bill
Analyse costs, kWh, peak demand, and usage trends with clear visual graphs. Quickly uncover insights that help you control spend and improve efficiency.
Book a call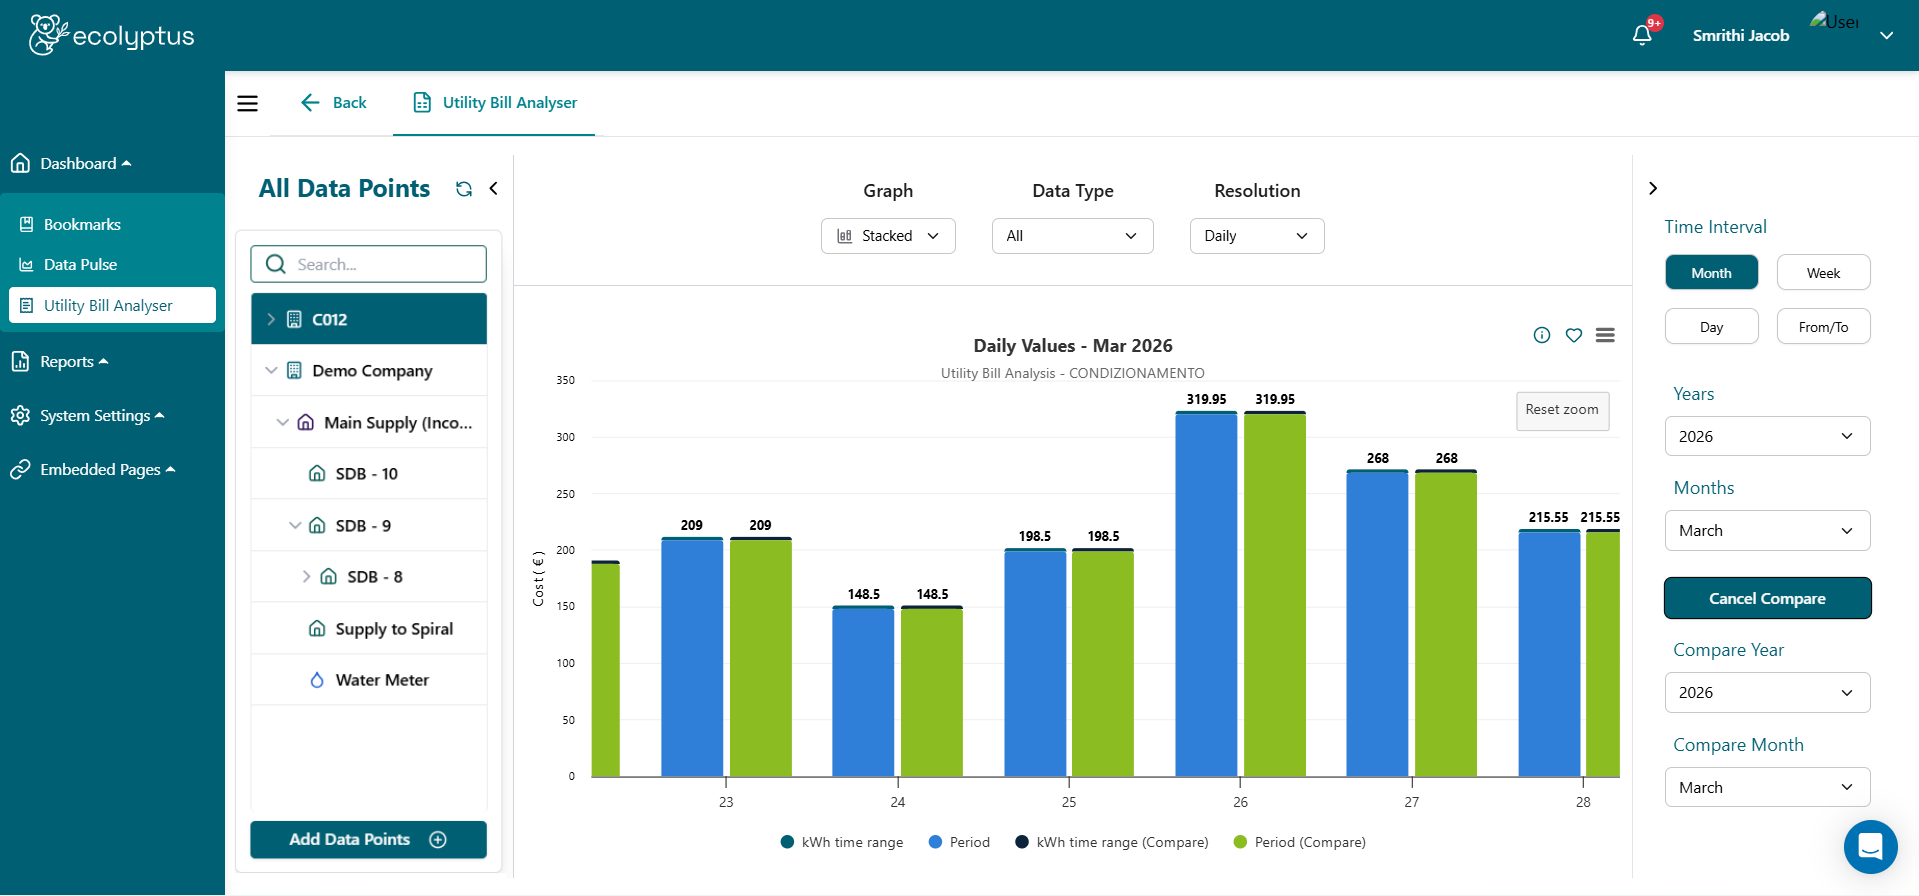
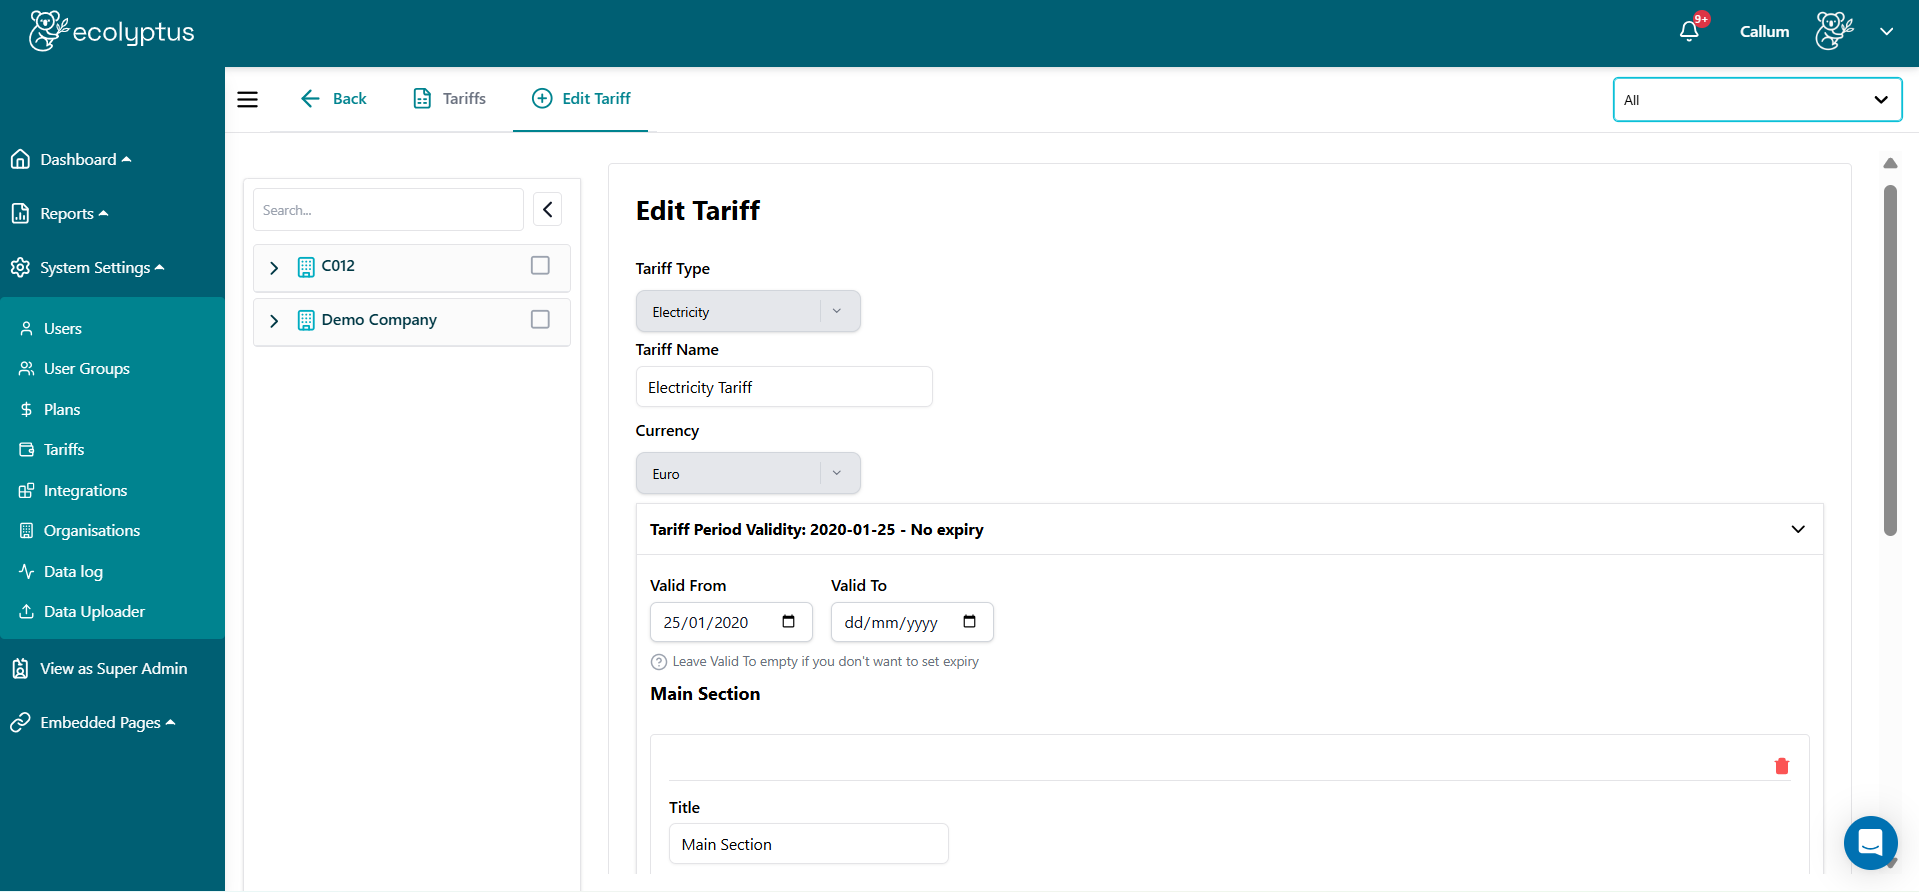
Add tariffs of any type
Model the exact shape of your energy costs by adding tariffs covering any charge type: kWh unit rates, kWh costs across time ranges, peak kVA demand charges, standing charges, and more. Each tariff can be scoped to a specific period, giving you accurate cost breakdowns that reflect real-world billing structures.
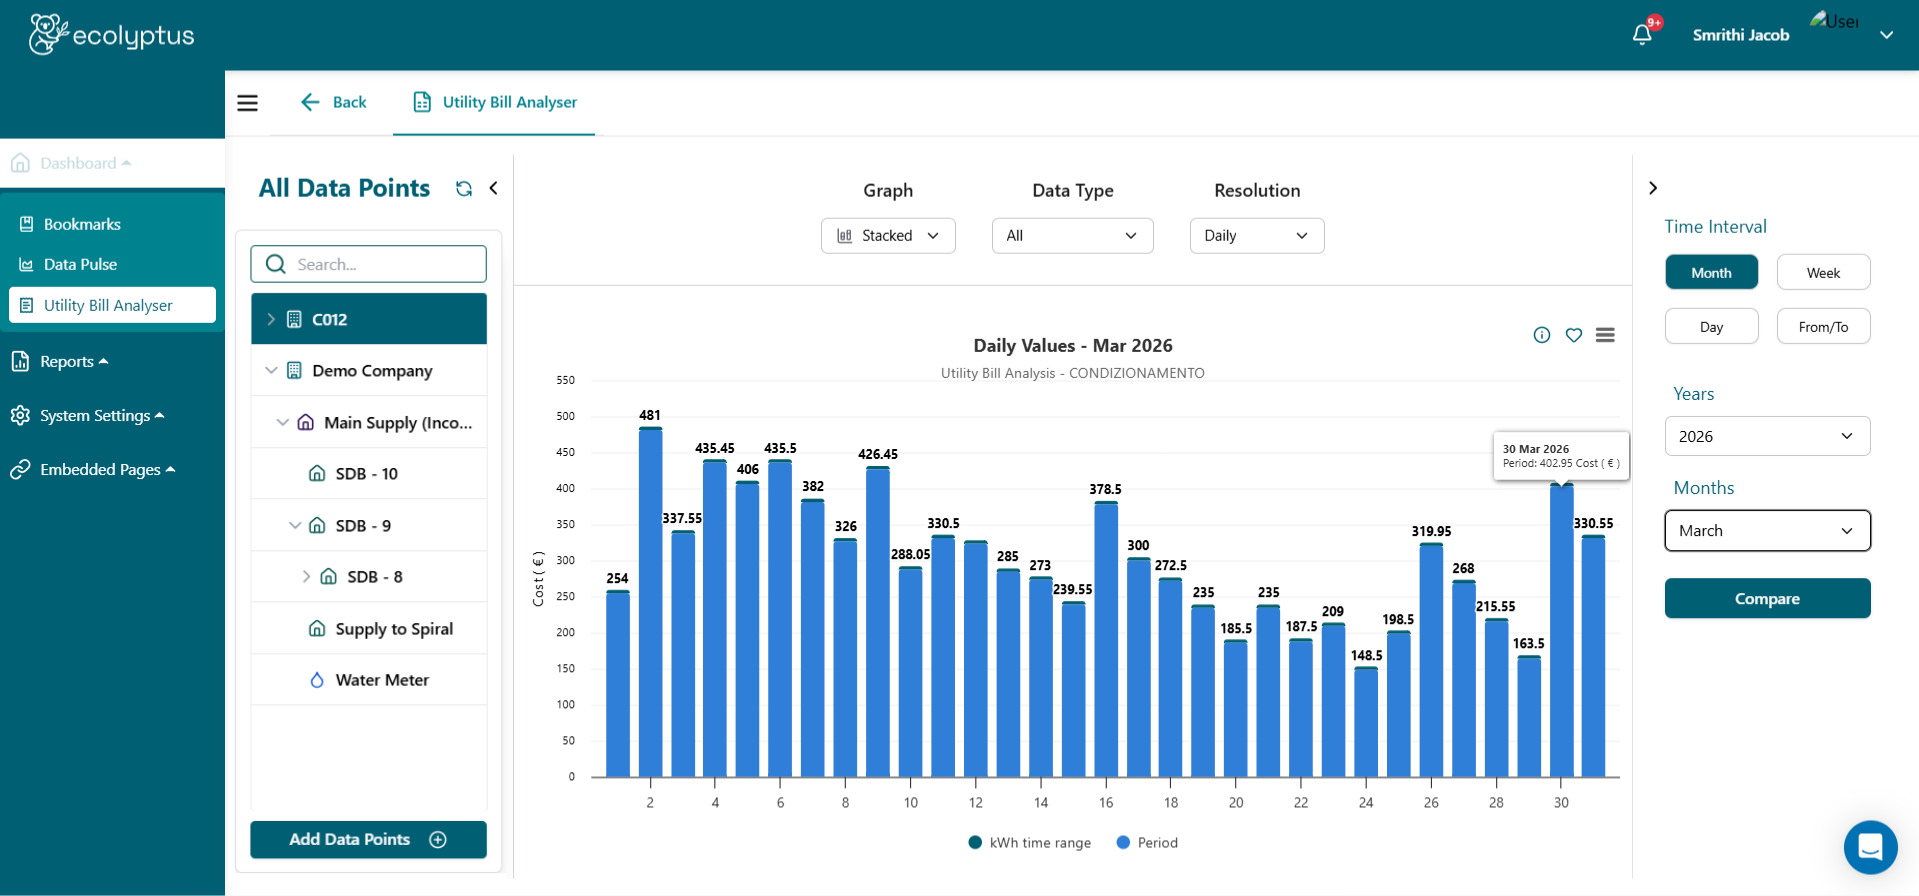
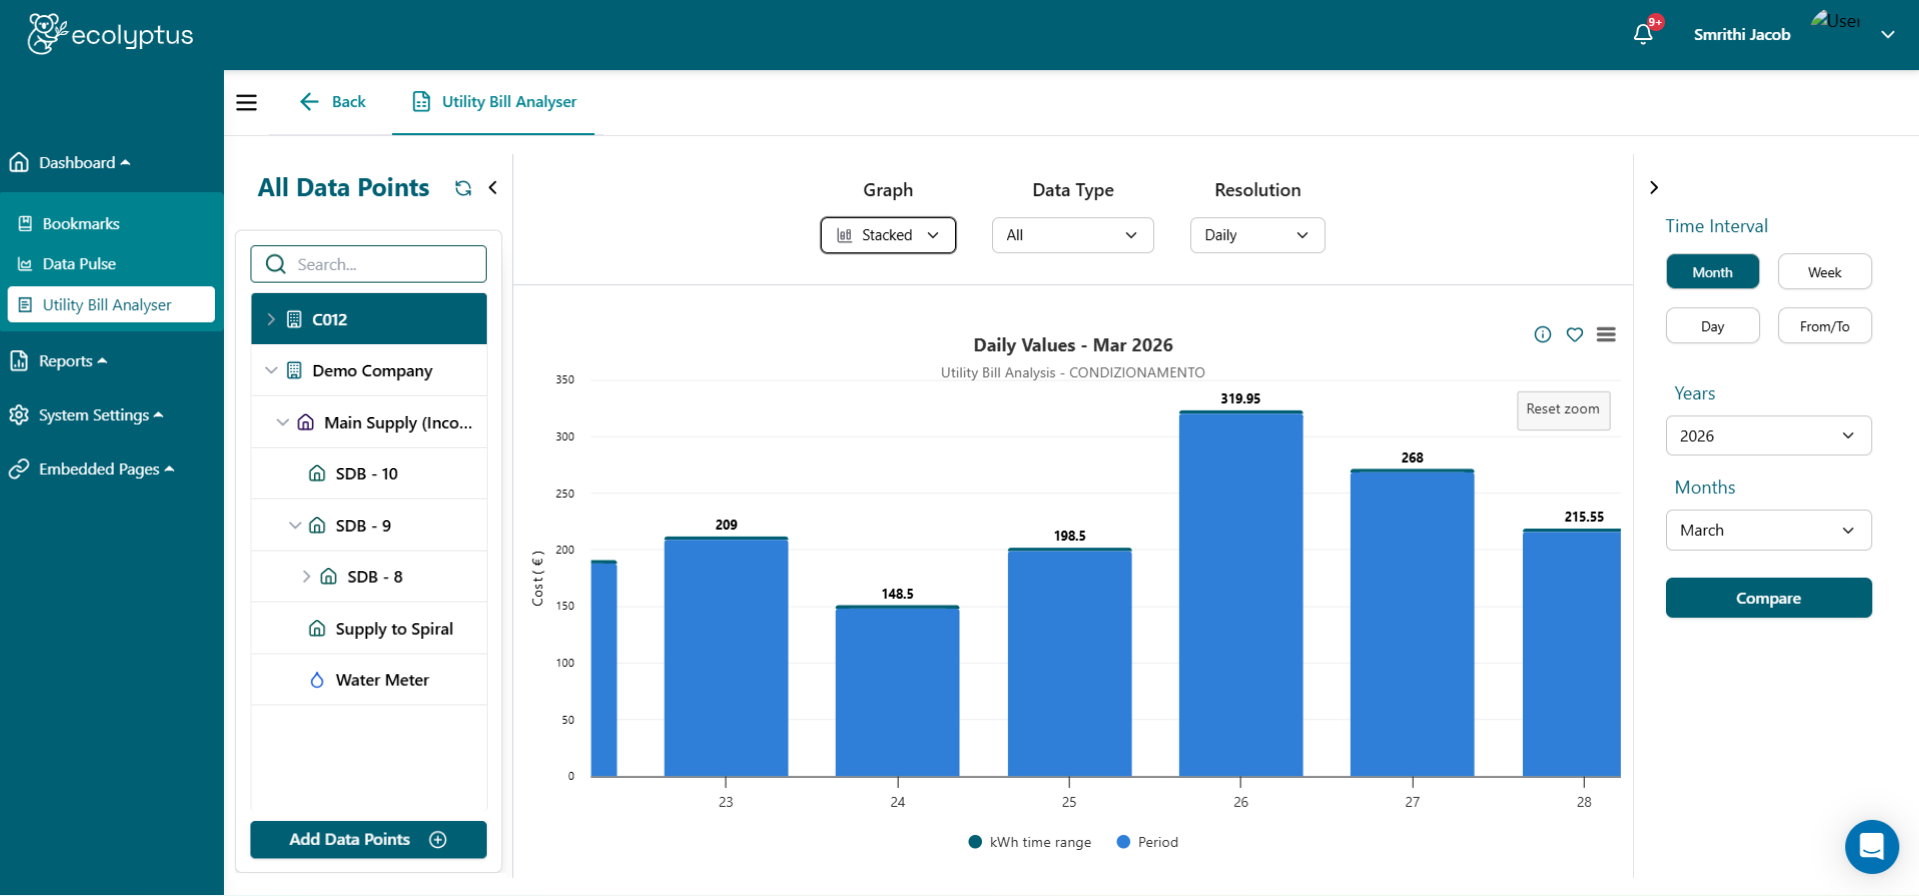
Visualise your utility data
Transform raw billing data into clear, actionable insights with a range of chart types, including stacked, column, and pie charts. Compare usage and costs across hours, days, months, or years to quickly reveal trends, anomalies, and performance shifts that might otherwise go unnoticed.
Track costs across bills
Break down costs across each bill to clearly see where money is being spent. The analyser highlights charges across various periods, making it easy to compare bills over time, spot irregularities, and monitor overall utility spend with complete transparency.