
See problems before they show up on your bill
Stop waiting for a spike to show up in next month's invoice. ecolyptus's forecasting module builds a live predicted range for any meter or data point, then compares it against real consumption as the day unfolds — so deviations are visible in hours, not weeks.
Book a Demo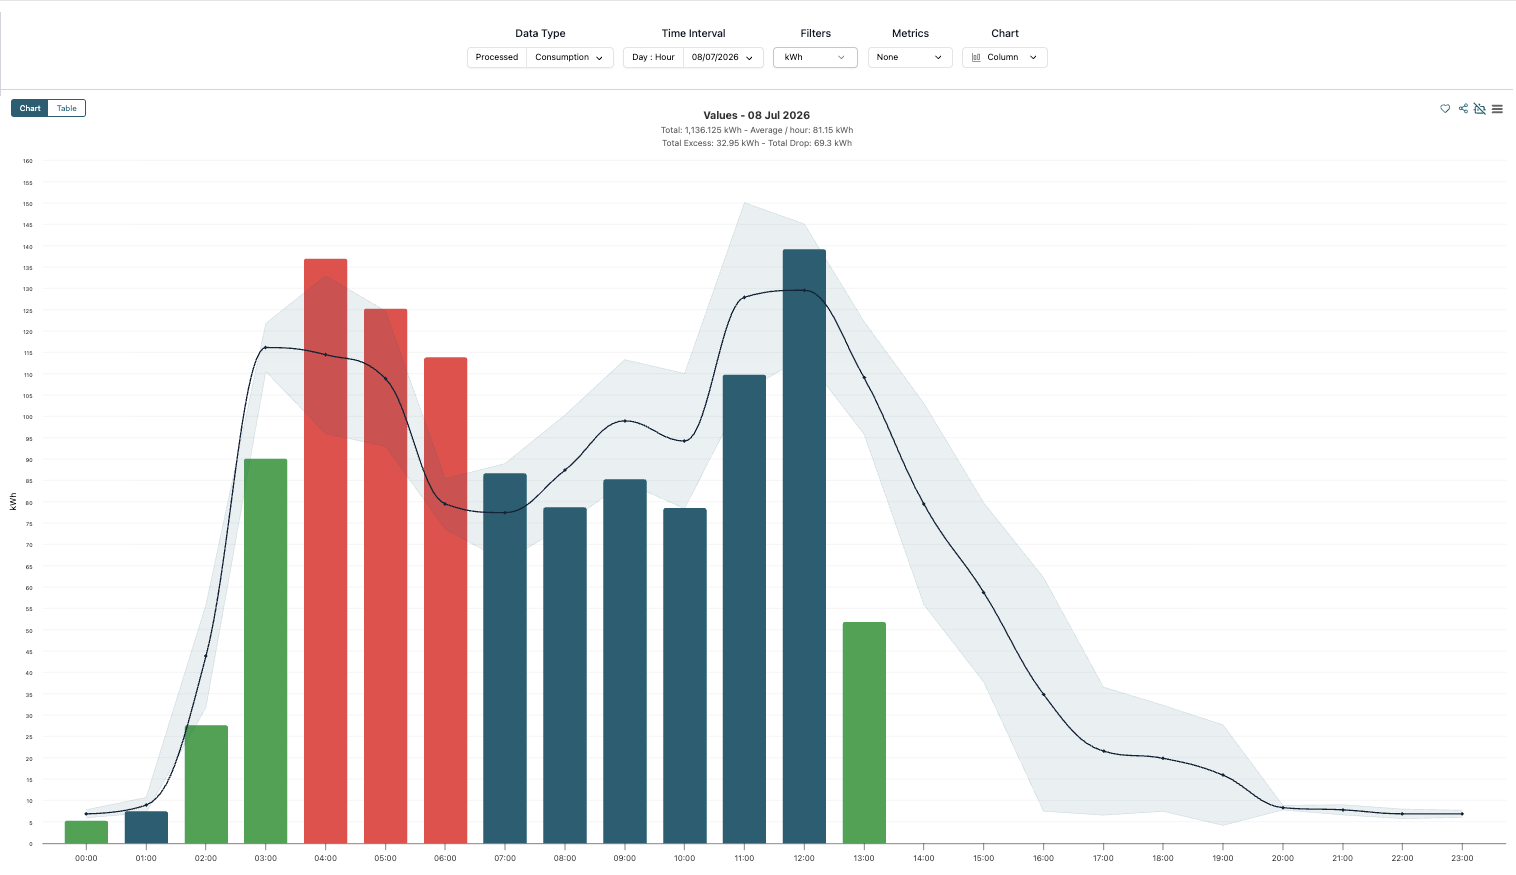
Instantly see where you stand
Every processed view overlays your actual consumption (as columns) directly against the predicted range (as a line and shaded band) — colour-coded so deviations jump out without reading a single number.
Raw data, real time
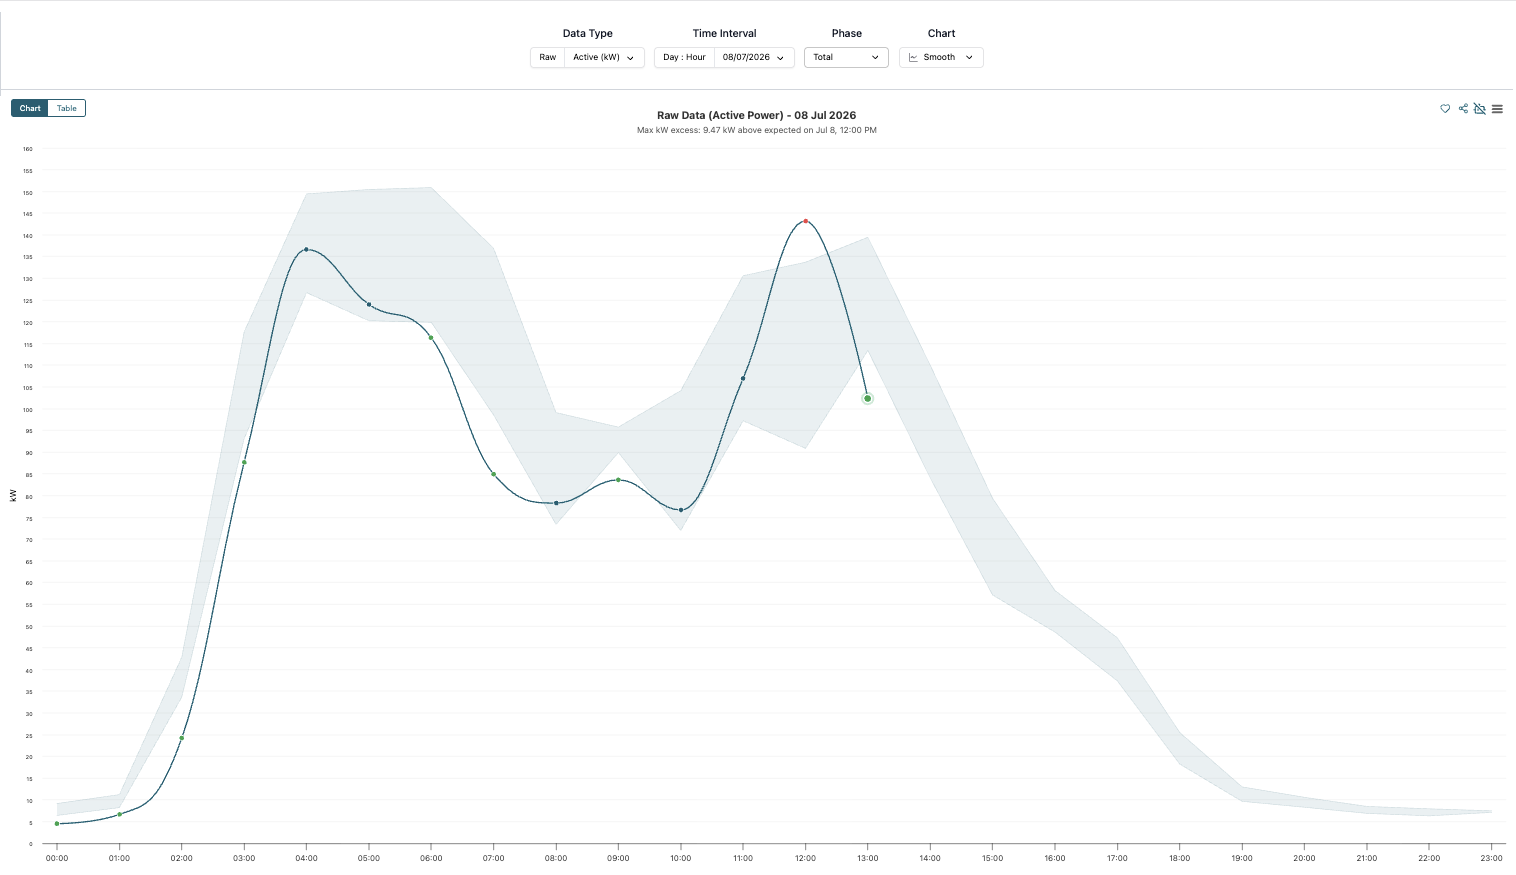
For a simpler, unfiltered read, switch to raw data to see a live line view of current-day consumption — ideal for a quick daily gut-check without needing to interpret variance bands.
- Available at daily granularity
- Shows real-time raw values as they're recorded
Live prediction, updated through the day
Select any single data point and see its forecast unfold in real time. The predicted range covers the current day and projects forward through the remaining hours, so you always know what's expected next — not just what already happened.
Rolling forecast
A rolling forecast for the remainder of the day, updated continuously as new data comes in.
Continuously compared
Continuously compared against real consumption as it comes in, so gaps are visible immediately.
Meter-level granularity
Works down to the individual meter or circuit level, not just whole-site totals.
Forecast across any time horizon
Zoom out beyond today. For processed data, view predictions across the current week, current month, or current year — each shown at the granularity that makes sense for that view.
Day view
Hourly granularity, tracking the forecast against consumption through every hour of the day.
Week & Month view
Daily granularity, so you can spot the specific days that drove a week or month off forecast.
Year view
Monthly granularity, giving a clean, high-level read on performance across the full year.
Why it matters
Most consumption problems aren't visible until the bill arrives — long after the chance to act on them has passed. ecolyptus's forecasting module closes that gap by putting an expected range in front of every meter you're watching, so a red bar at 9am is something you can investigate that morning, not a mystery you're reconciling weeks later.
Catch it the same day
Catch equipment faults and abnormal usage the same day they happen, not weeks later.
Plan with a real baseline
Plan budgets and demand around a realistic forecast, not last year's average.
Scan at a glance
Scan a whole day, week, or month for deviations at a glance, without digging into raw tables.